23 Jun, 2010 von Raimar Wagner
Histogramplot in Sage/Matplotlib
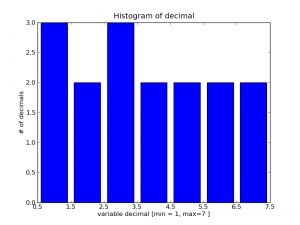
Wer Matlab mag wird Sage lieben, insbesondere wenn die Ausgangsdaten sowieso in Python vorliegen. Ein einfaches Histogram für Ganzzahlen lässt sich wie folgt realisieren:
from sage.all import *
import numpy
import matplotlib.pyplot as plt
import matplotlib.mlab as mlab


def plot_hist(subplot,name,x_data,x_var,y_var,b_width):

  #create array
  n_array = numpy.array(x_data)

  #labels
  subplot.set_xlabel('variable '+x_var+' [min = '+str(n_array.min())+', max='+str(n_array.max())+' ]')
  subplot.set_ylabel(y_var)


  #create bins
  mmin = n_array.min()
  mmax = n_array.max()
  b = numpy.arange(mmin-(1.0/2),mmax+1+(1.0/2))

  #set ticks
  subplot.set_xticks(b)

  #hist
  n, bins, patches = subplot.hist(x_data,bins=b, rwidth=b_width)

  #title
  subplot.set_title(r'Histogram of '+x_var)
Benutzt wird das Ganze dann mittels:
f = matplotlib.pyplot.figure()
a = f.add_subplot(111)

plot_utils.plot_hist(a,'Decimals', [1,1,1,2,2,3,3,3,4,4,5,5,6,6,7,7],'decimal','# of decimals',0.8)


matplotlib.pyplot.savefig('plot.png')


Letzte Kommentare